SaaS companies can command high valuation multiples because they have the ability to scale quickly and generate significant Free Cash Flow (FCF) at scale. However, it is important for investors and operators to consider that revenue multiples alone do not fully capture the underlying value of a company.
The true valuation of a company is determined by its future cash flow potential, which is closely tied to its Unit Economics. Operators and investors can make better decisions and grasp the long-term value of a company by understanding and analyzing the Unit Economics, rather than relying solely on simplified valuation metrics.
Unit Economics
Unit Economics in software refers to the impact on a company’s financials when adding a new customer or generating an additional dollar of revenue over the customer’s lifetime. It seeks to answer the question of how much money a company can earn from selling its product to a customer.
Acquiring Customers
SaaS companies face the challenge of incurring significant upfront costs to acquire new customers, resulting in prolonged periods of losses. Only if customers continue to renew their subscriptions the company can reach profitability.
The Payback Period is a metric that indicates the time it takes for a company to recover its customer acquisition expense, specifically sales and marketing spending.
Payback Period = (S&M Fully-Loaded Expense) / (New ARR * Subscription Gross Margin %) * 12
* It’s important to consider the true cost of a S&M department. These should include not only Wages but also Employer Contributions, T&E, Recruiting Fees, Software, etc.
** Timing plays an important factor in this. With longer Sales Cycles, for example, it’s a good idea to offset the S&M Expense to ensure it is divided by the results generated from that spend. Which could materialise one or more months later.
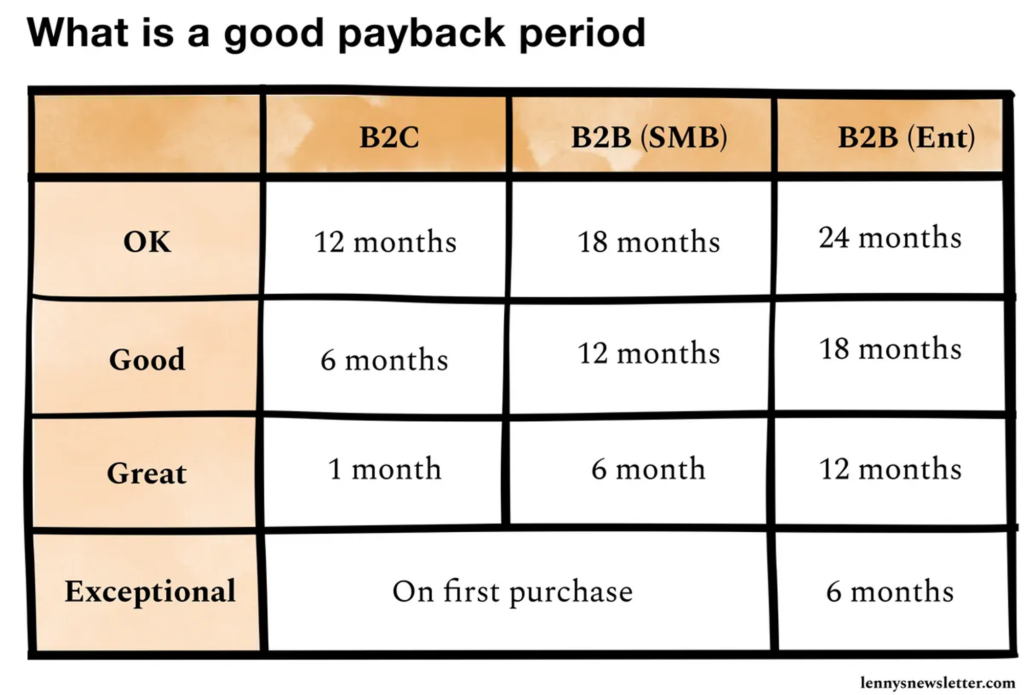
Below is a great chart from Lenny Rachitsky on the general rules of thumb for good Payback Periods:

Here are some important points about the Payback Period:
-
- The Payback Period is not an efficiency metric, but rather a risk metric that indicates how long it takes to recover the initial investment. A company with a 6-month Payback Period may have poor Unit Economics if customers typically churn after 7 months.
-
- Longer Payback Periods are more acceptable for companies targeting the enterprise segment, as these customers tend to have longer retention and higher potential for expansion.
-
- Payment terms can have a significant impact on the cash flow implications of the Payback Period and the overall cash flow situation.
-
- The Payback Period only considers the time to break even on S&M and does not account for research and development (R&D) or general and administrative (G&A) expenses. Companies investing heavily in R&D may take even longer to achieve positive cash flow.
The Cash Flow Trough
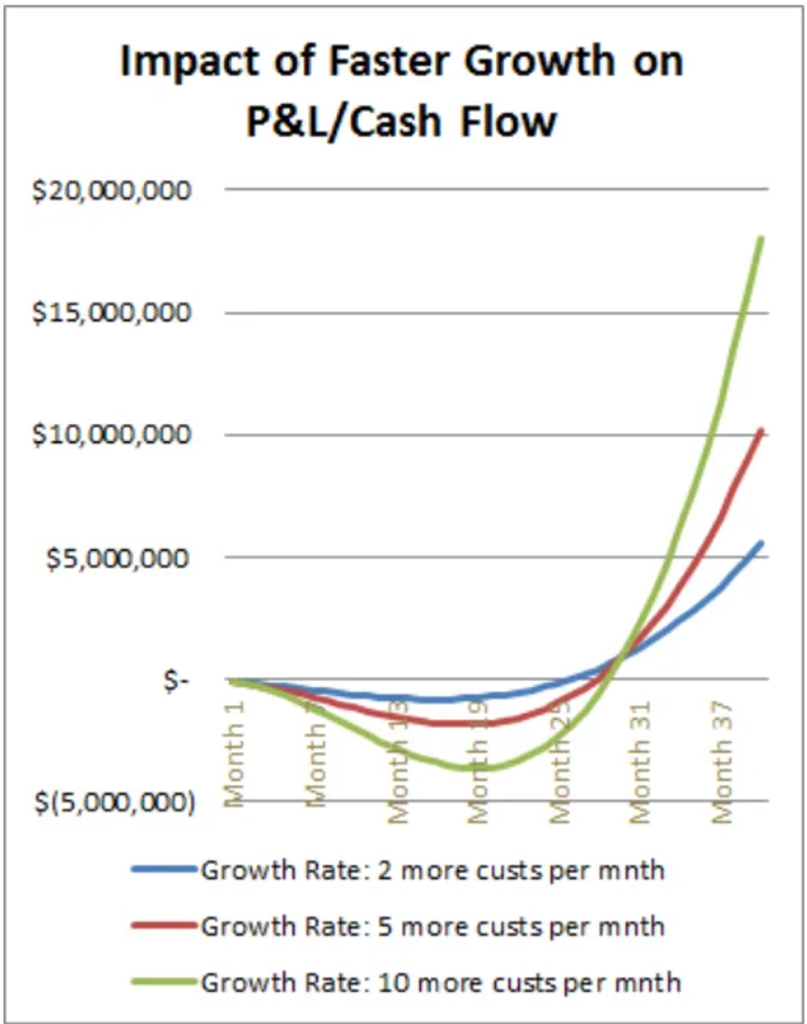
This leads us to a key concept for understanding the cash burn of SaaS companies. The Payback Period explains the reason behind the substantial cash outflows in rapidly expanding SaaS firms, while the Cash Flow Through demonstrates the consequential impact on cash depletion.
The quicker a firm grows, the bigger this cash flow dip becomes. It happens because the time it takes for each customer’s CAC payback overlaps faster than the profits coming in from customers on the flip side of the cash dip.
However, when growth starts slowing down, these companies start seeing swifter and more consistent cash inflows. The magic lies in balancing this cash flow dip with how much cash a company has and when it’s time to raise another round.
If the Unit Economics are looking great, companies will want to step on the gas and snag as many customers as they can. But this also means that the Cash Flow Through gets deeper, and the company will be burning out cash upfront (hoping customers will stick around after the Payback Period and become profitable.) That’s why companies need to be savvy about how they handle their cash and when they come knocking for more capital.

The visual representation displayed above underscores the pivotal importance of sound Unit Economics. When Unit Economics take a nosedive, escaping the Cash Flow Through becomes an insurmountable challenge.
The Burn Multiple
There are more costs to recoup than just S&M: the aggregate profits must also recoup costs from the below items before a company is cash flow positive: R&D and G&A.
If Unit Economics are in bad shape, generating adequate cash flow from customers to recover investments in these areas becomes an uphill battle.
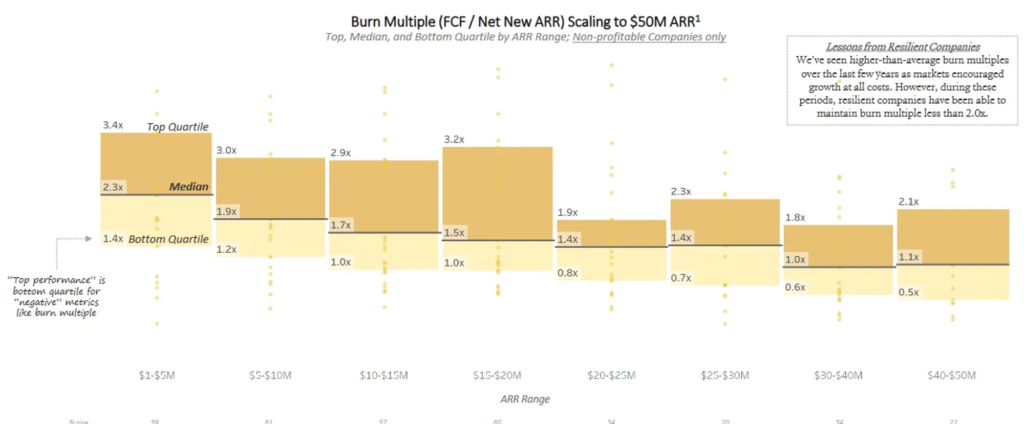
This introduces another noteworthy metric (although it doesn’t necessarily gauge the quality of Unit Economics): the Burn Multiple. This ratio shows the amount of cash a company consumes to generate $1 of net new Annual Recurring Revenue (ARR).
Burn Multiple = Net Cash Burn / Net New ARR
I find the Burn Multiple appealing because it’s resistant to manipulation or concealment and incorporates all cash expenditures. The quality of cash burn ratios, whether good or bad, hinges on three factors: 1) growth rates, 2) the company’s developmental stage, and 3) company-specific variables (such as product complexity).

As ARR grows, the Burn Multiple should decline due to slower growth rates (signifying more customers emerging from the Cash Flow Through and boosting profits) and the increase of operational efficiency.
While the Burn Multiple can offer a bird’s-eye view of capital efficiency, it doesn’t provide insight into the quality of Unit Economics. Even if a company boasts an impressive Burn Multiple, its viability can be in jeopardy if Unit Economics are flawed.
The enchantment of SaaS lies in the fact that if customers renew their subscriptions, the marginal cost in subsequent years remains relatively modest. Consequently, each additional year of retaining customers yields substantial profits, underscoring the true potency of SaaS Unit Economics.
Unit Economic Metrics
We’ve delved into the reasons behind the prolonged losses endured by SaaS companies and introduced certain metrics that offer indirect insights into unit economics.
Think of unit economics as akin to an income statement at the individual customer level. In principle, the optimal approach to grasping unit economics involves examining the following:
-
- Lifetime Value of a Customer (LTV)
-
- Customer Acquisition Cost (CAC)
I’ve previously defined CAC. LTV, as elucidated below, signifies the total revenue generated from a customer throughout their lifetime, after deducting the ongoing expenses associated with managing the software:
LTV = (Average ARR * Subscription Gross Margin %) / Churn Rate %
Standardizing LTV by adjusting it with the gross margin percentage facilitates comparisons among various SaaS companies with divergent gross margin figures.
With LTV in hand, you can tell how much revenue a customer contributes toward covering operational expenditures, including S&M, R&D and G&A.
The costs directly tied to acquiring a customer are encapsulated in S&M (or CAC), while R&D and G&A costs should dwindle as a percentage of revenue as companies establish operational efficiency. This is why the LTV/CAC ratio is a prominent SaaS metric for Unit Economics.
A common rule of thumb used to be: A favourable LTV/CAC ratio should be equal to or exceed 3. But in today’s world, an LTV/CAC ratio of 3 sets a relatively modest benchmark. Most successful companies tend to gravitate towards ratios exceeding 6.
For instance, consider a company that seals a deal with an LTV of $120,000 and a CAC of $40,000, yielding an LTV/CAC ratio of 3. In this scenario, there remains $80,000 to cover the costs of R&D and G&A, with the hope of substantial profits left over for the company.
However, it’s imperative to remember that context is pivotal when assessing metrics. What qualifies as a commendable LTV/CAC ratio hinges on other expenses. For instance, companies following a product-led growth (PLG) model often allocate substantial resources to R&D. In theory, CAC could be low because the company is funnelling a considerable sum into R&D. In such a scenario, a high LTV/CAC ratio may not be as appealing, given the additional R&D expenses that need to be recouped before profits materialize.
Expansion
Another facet contributing to a customer’s LTV pertains to the growth possibilities that materialize during the customer’s journey. Companies capable of expanding their customers over time significantly enhance the actual LTV. Interestingly, this aspect is typically not encompassed in the LTV/CAC ratio, so companies exhibiting substantial expansion potential merit a closer look. A company’s expansion potential finds expression in its Net Revenue Retention (NRR) metric.
NRR = (End of Period ARR - Churned ARR - Downgrade ARR + Expansion ARR) / Beginning of Period ARR * 100
One of the reasons expansion revenue stands out is its lower cost compared to revenue generated from new business, thereby adding more dollars to the bottom line. Consequently, businesses with greater expansion prospects tend to enjoy more favourable Unit Economics. A good rule of thumb is that expansion dollars incur approximately one-third of the cost of acquiring new business.
Word of Caution Using LTV
LTV/CAC is an outstanding metric for comprehending Unit Economics, but it harbours a significant drawback – assumptions regarding customer churn. To arrive at customer lifetime, we employ the inverse of the churn rate (1/churn rate). For instance, if a company boasts an annual churn rate of 10%, there’s an implicit assumption of a 10-year customer lifetime.
Early-stage companies often lack precise insights into their actual customer lifespans, and their estimations are frequently based on benchmarks. Additionally, many companies still rely on benchmarks and churn data from the previous decade’s SaaS boom. The future landscape is likely to differ—especially with heightened competition, the advent of generative AI, and other evolving factors. Hence, most companies should adopt a more conservative approach when calculating LTV.
Strategic Advantage from Efficient CAC
Companies can secure strategic advantages through various means—technology, distribution, data, and more. However, an efficient Go-To-Market (GTM) strategy can also wield significant strategic influence.
If a company can acquire customers at a notably lower cost than its competitors, it gains the capacity to allocate more cash and outpace its rivals.
Final Thoughts
The ultimate driver for a company’s worth lies in its future cash flows. Grasping a company’s Unit Economics stands as a pivotal factor in gauging the potential profitability of a company when it attains substantial scale.
The vision for SaaS companies is that, upon reaching scale, they can maintain a robust FCF margin exceeding 30% over an extended period. This vision explains why SaaS companies often carry lofty valuations relative to their present revenue figures – their rapid growth is coupled with the promise of exceptionally high cash flows.
A firm grip on Unit Economics serves a dual purpose: it empowers a company to fathom its potential profitability and provides valuable insights for pivotal decisions aimed at driving further growth and profitability. These insights include:
-
- Identifying ill-fated investments
-
- Shaping pricing strategies and optimizations
-
- Revealing high-return-on-investment sales channels
-
- Identifying the best-performing customer segments, products, geographical markets, and more
CEOs and operational leaders must master Unit Economics to steer their companies toward astute long-term decisions to maximize the potential for future cash flows.

